


The secret of successful reporting is tailoring reports to audience-specific metrics. Whether your client or your CEO wants to see the results of your marketing efforts, or you want to present interesting facts you found out through social listening to your product development, customer support, or sales team, the easiest way to do that is to create a social listening report and present the most important insights.
The catch? Don’t use the same report for everyone. Choose the specific segments and metrics that show data that is most useful for each of them.
In this article, you’re going to show you how to create standard and custom social media listening reports with Mentionlytics, which one to choose (custom or standard options), and how a real-time updated dashboard can benefit your goals.
Table of Contents
- How to Create a Standard Social Listening Report & Examples
- How to Create a Custom Social Media Listening Report & Examples
- Standard vs Custom Listening Reports: What to Choose & When
- An Alternative to Consider: Real-Time Updated Social Listening Dashboards
- Generate Your Social Listening Report for Free Today
- FAQ
How to Create a Standard Social Listening Report & Examples
Standard social listening reports you can use for quick reporting. There’s no need to change anything, and you can get it with just one click. These social listening report templates are a great way to present the basic social listening insights and track progress.
If you are a free trial user of Mentionlytics, you can choose one of the eight available social listening report templates, depending on what you are interested in:
- Top Mentions Report with Emotion Analysis
- Influencer Report
- Share of Voice
- Top Mentions Report (Colorful)
- Top Mentions Report (Plain)
- Facebook Owned Media Analytics
- Instagram Owned Media Analytics
- LinkedIn Owned Media Analytics
What the Top Mentions Report with Emotion Analysis includes:
- Overview
- Sentiment analysis
- Emotion analysis
- Media share
- Word cloud
- Geography – languages and countries
- World map
- Web, X (Twitter), Facebook, Instagram, YouTube, and other mentions
- The list of Top mentions for each

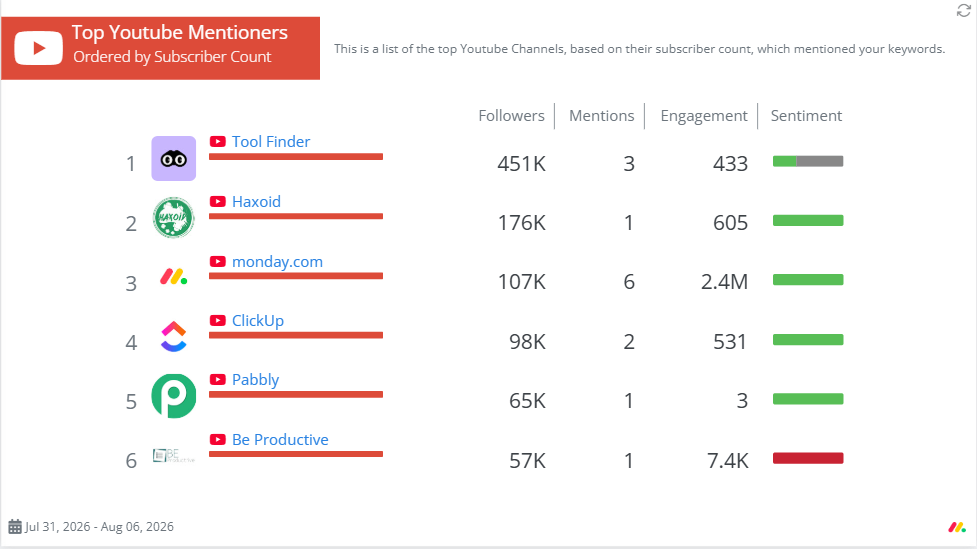
What the Influencer Report includes:
- Top mentioners charts for each of the social platforms (e.g., X, Facebook, Instagram, YouTube), web, and other sources
- Keyword cloud
- Geography and world map, showing you where these influencers come from and what languages they speak
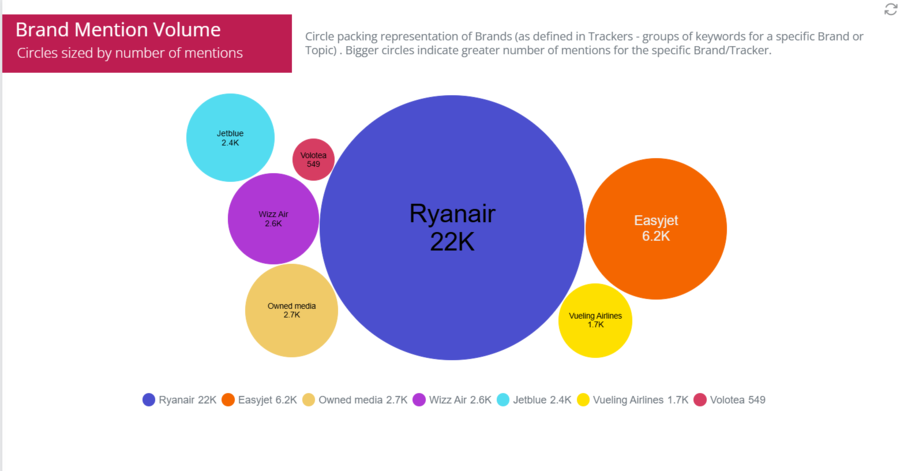
The Share of Voice report shows your SoV through:
- Brand mention volume
- Mention volume graph
- Sentiment
- Total mentions per weekday and countries
What the Top Mentions Report includes:
- Overview
- Sentiment analytics
- Media share
- Keyword cloud
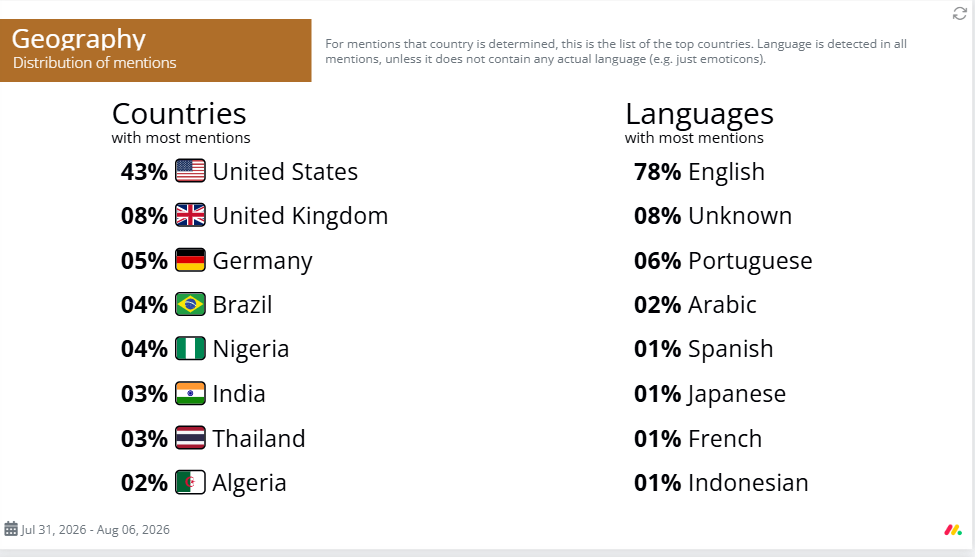
- Geography
- World map
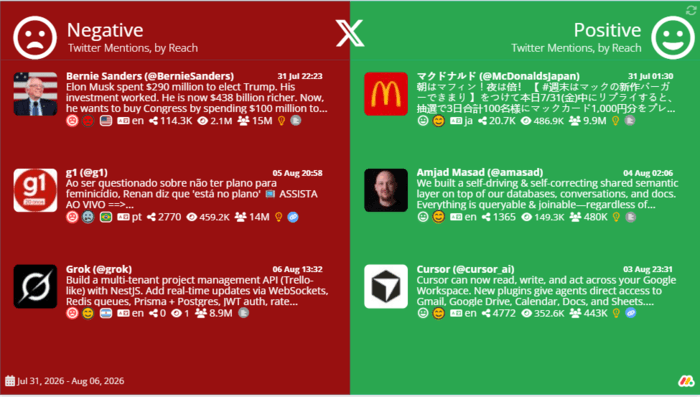
- Segmented Facebook, YouTube, Instagram, X, web, and other channels’ top mentions and the top mentioners for each
The Top Mentions Report (Colorful) is the same Top Mentions Report, only with a colorful theme.
Facebook Owned Media Analytics Report: This is a social listening report template only for Facebook.
It contains:
- Page metrics (followers, fans, views, organic views, paid views)
- Performance summary (with organic, paid, and overall views, engagement, engagement rate, and post link clicks)
- Follower growth through days
- Publishing behavior
- Post performance
- A separate table for engagement, engagement rate, fan demographics, and video performance
Instagram Owned Media Analytics Report:
- Page metrics (followers, reach, views, posts)
- Performance summary (views, total engagement, post count, reach, total likes, total comments, and total shares)
- Follower growth throughout weekdays
- Publishing behavior
- Post performance
- A separate chart for engagement, views, and engagement rate, demographics (fans and reached audience), and gender and age for followers and reached audience

LinkedIn Owned Media Analytics Report:
- Page metrics (views, followers, and posts)
- Page summary (views, total engagement, post link clicks, post count, total likes, total comments, total shares)
- Follower growth through workdays
- Publishing behavior
- Post performance
- Fan demographics
- Separate charts for engagement, engagement rates, and views
Six Steps to Access Social Listening Report Templates in Mentionlytics
You can easily access these templates just by following the steps:
- Open your Overview Dashboard and choose the media platforms you want to see reports for, and you can set specific filters (country, language, sentiment, label, etc.).
- Choose the dates you want your social listening report template to run.
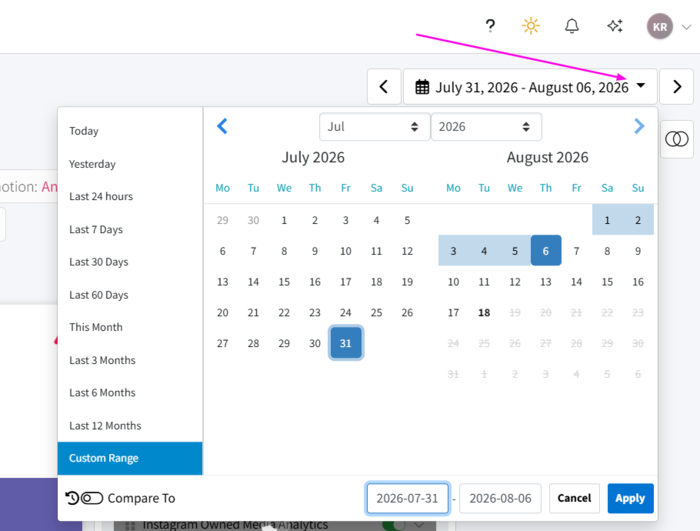
- Click on the right-side menu and choose Reports.
- Click on the Report button just below the filters to select the template you want.
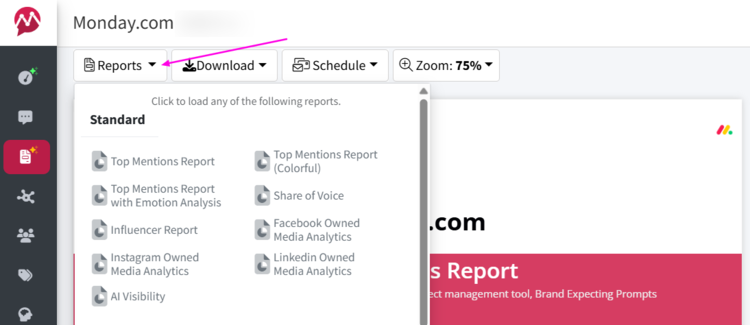
- Select one of the available templates from a drop-down menu.
- Once you click on the selected template, your social intelligence insights will be summarized in the report, and you can download it in the form of a PDF, PPTX file, or export it to your Canva account.
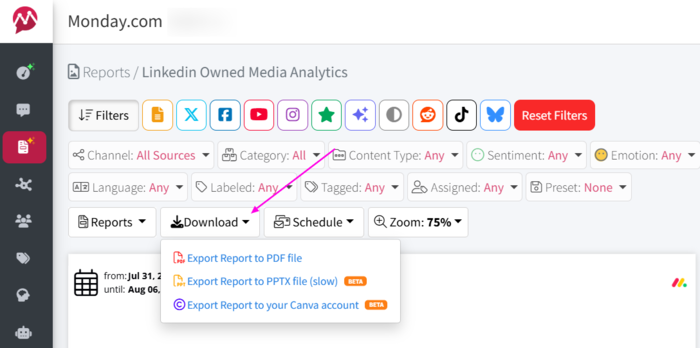
You can automate this report to run weekly or monthly and send it automatically to a specific email address or your Slack channel.
Need an Automated Report Every Month?
Mentionlytics helps you customize and schedule your report to run on autopilot.
How to Create a Custom Social Media Listening Report & Examples
Custom social media listening reports are more complex because they let you customize your report with colors, chart types, and most importantly, insights not available through templates. Effective social media listening provides various raw data that sometimes cannot be analyzed manually because of multiple social media channels and a large volume of collected information.
The process is almost identical to the standard reports, only this time, if you want to customize your report with some other elements, you do it through Report Builder.
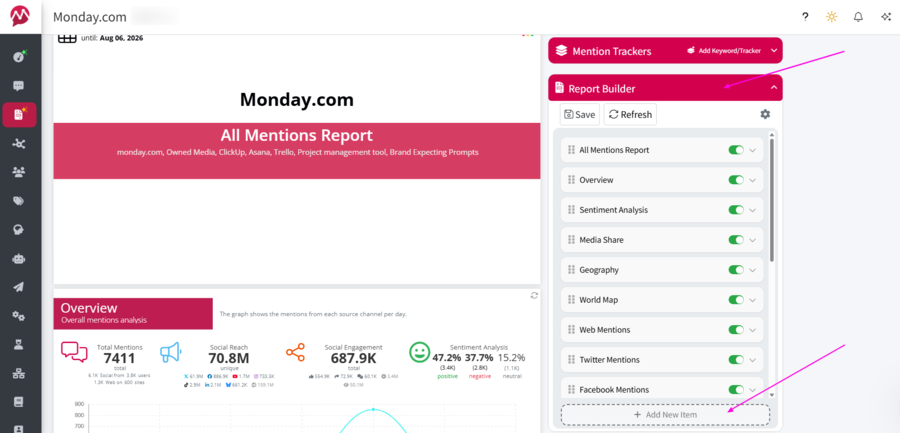
Besides standard elements, with a customized version, you can build a report that contains TikTok, Bluesky, and Reddit mentions and reviews, and you can make AI mentions a part of your social media listening report if you have access to the AI Visibility add-on.
Custom reports allow you to customize each element by clicking the expand arrow within the element button.
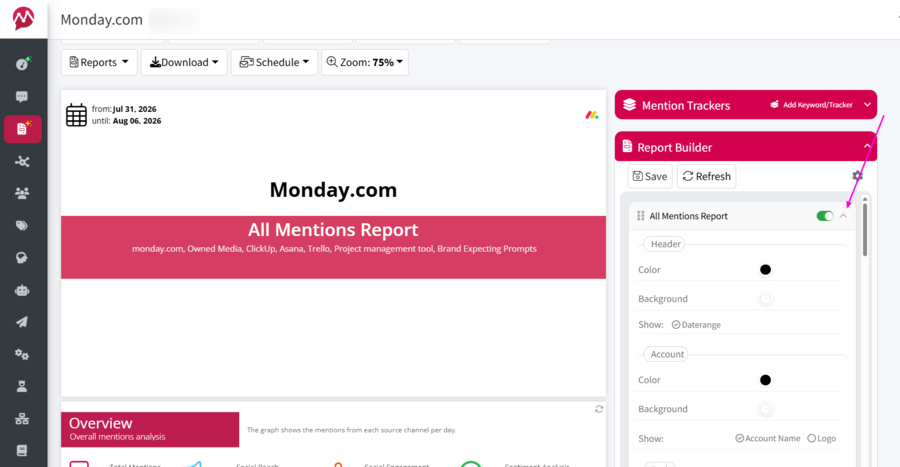
That way, you can change the color, insert your logo or image, and change the color of the background, font, and size. You can also choose which metrics will be presented in each element and what type of graph will be used.
For all elements, you can filter by tracking keywords, channels and campaigns, content type, sentiment, emotion, tags, or tracker type.
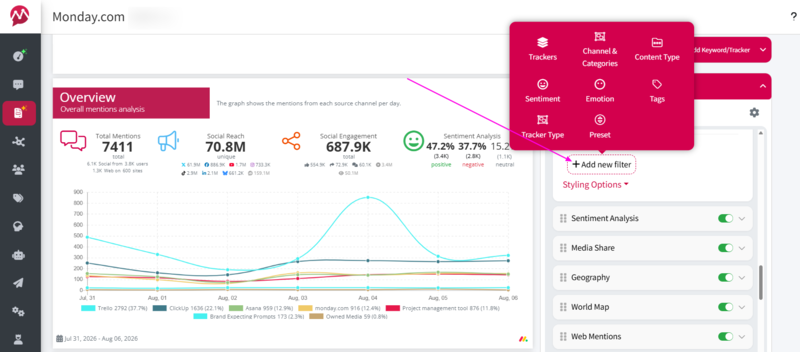
Within the custom social media listening reports, you can also add elements like:
- Mention Clusters
- Image Analysis
- Mention Highlight
- SIA Insights
- Daily Topic
Mention Clusters: Ideal for brands with a large volume of mentions. This AI-powered feature clusters mentions related to the same topic and presents the overall number of mentions, social platforms, reach, engagement, and sentiment.
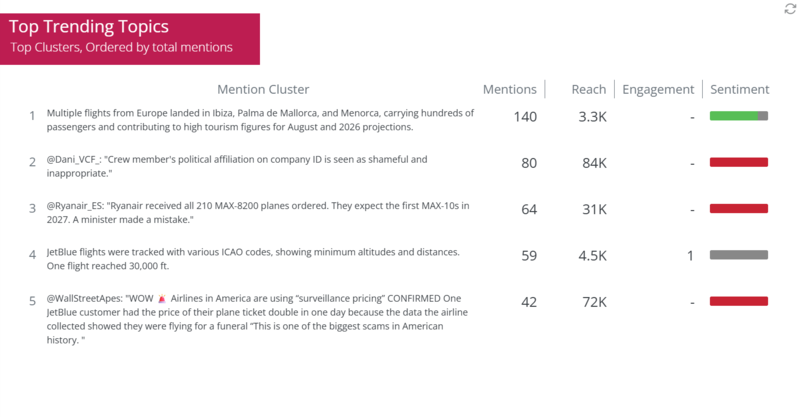
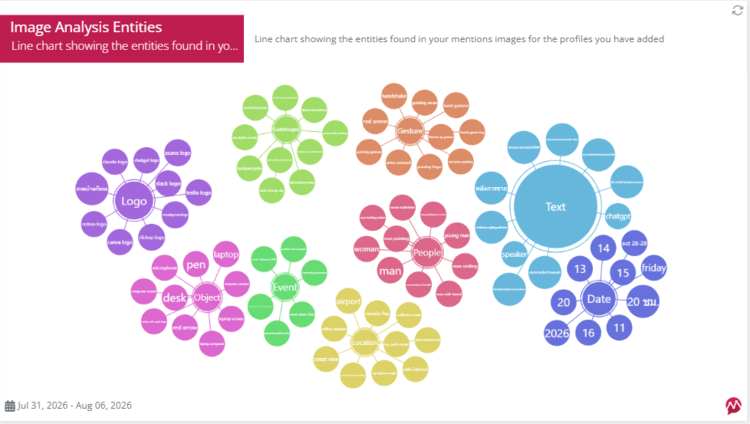
Image Analysis Entities: Discovers what elements images with your mentions contain. It’s a useful option if you want to go beyond monitoring and add context about the people, places, and logos appearing alongside your brand.
Mention Highlight: This AI-powered insight automatically highlights one mention from social networks and provides the mention and a mention summary, along with engagement, reach, and a comments summary with sentiment. This way, you can show, for example, how the target audience is reacting to some social media posts.
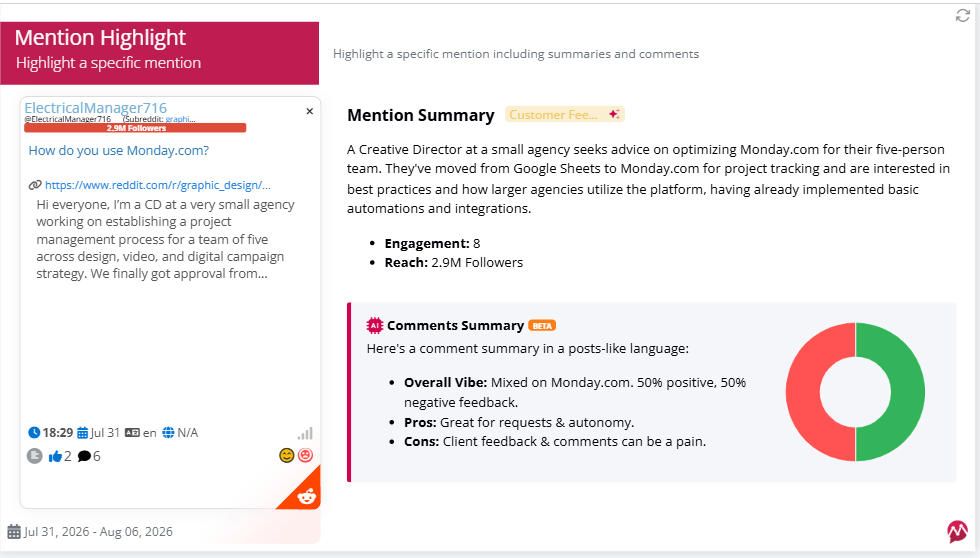
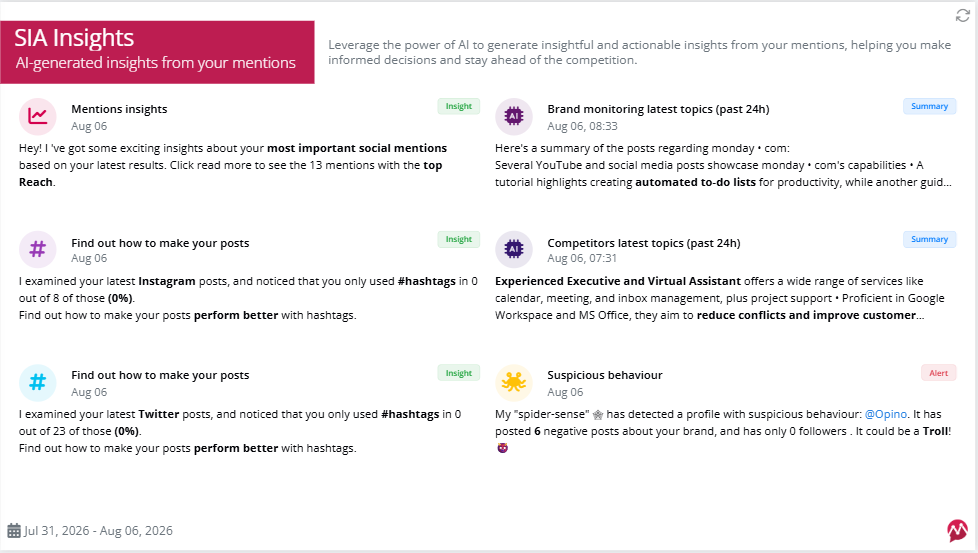
SIA Insights: The AI-powered Social Intelligence Advisor (SIA) scans your mentions daily and provides actionable insights on hashtags, trolls, hot topics, emerging themes, sentiment trends, customer experience and pain points, and competitor analysis across social media. The most impactful mentions summarized by SIA can be a valuable part of your social listening report.
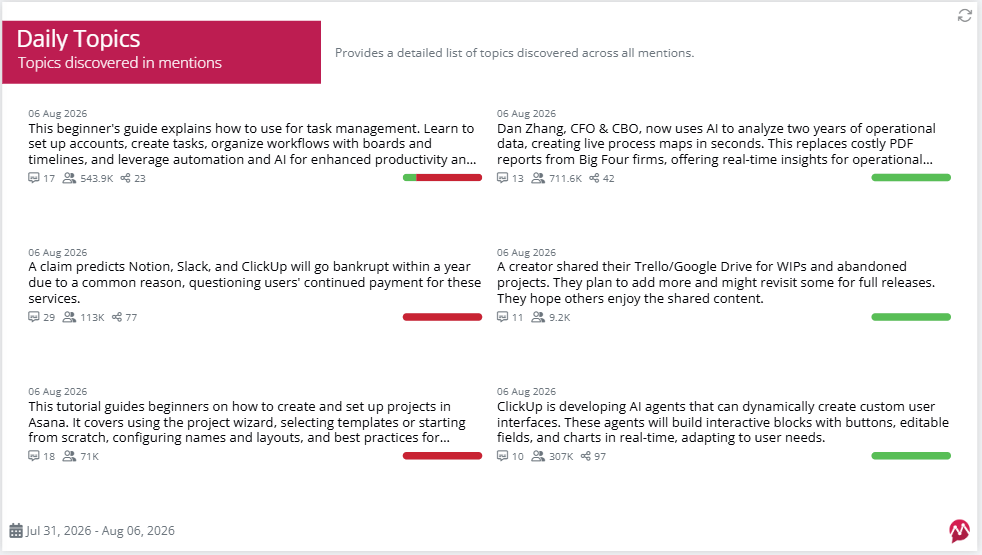
Daily Topic: This element provides an overview of the topics where your brand was mentioned daily. Useful element if you want to track the impact of your PR campaign.
Standard vs Custom Listening Reports: What to Choose & When
Whether you need a standard report or want to present your listening ROI at a higher level through a custom report will depend on several factors, such as the size of your company, available resources, industry, marketing strategy, volume of mentions, audience, reporting goals, and more:
| Standard social listening report template | Custom listening report | |
| Reporting goals | Routine tracking (mention volume, sentiment, reach, and SoV). | Finding the answers to a specific question, like detecting why sentiment became negative after a product update. |
| Audience | The same report works for the entire team. | Executives, PR, marketing, customer support, or clients need different metrics and views. |
| Use case | You are tracking everyday brand performance. | You are analyzing a campaign, product launch, crisis, competitor, or customer issue. |
| Company complexity | You manage one brand, market, language, or product line. | You manage several brands, markets, languages, regions, or product categories. |
| Level of detail | A general performance overview is enough. | Mentions must be filtered by topic, sentiment, platform, location, language, or audience. |
| Reporting frequency | You need automated weekly or monthly updates. | You need one-off research, real-time crisis reports, or reports triggered by specific events. |
| Metrics | Common social listening metrics cover your needs. | You need selected KPIs, custom calculations, benchmarks, or competitor comparisons. |
| Data sources | Social listening data is sufficient on its own. | Listening data must be combined with CRM, sales, web analytics, or customer-support data. |
| Presentation | A ready-made dashboard or template is acceptable. | The report needs specific branding, commentary, structure, or client-ready formatting. |
| Resources | Your team has limited time or analytical capacity. | Your team can set up, maintain, and interpret more complex reports. |
| Budget | You want a quick and cost-effective reporting option. | The additional relevance and depth justify the extra time and cost. |
| Decision-making | You want to know what happened. | You need to understand why it happened and what to do next. |
An Alternative to Consider: Real-Time Updated Social Listening Dashboards
Social media mentions are happening in real time, so if your dashboard is 12 hours late, that means you might miss the chance to catch early signs of crises and prevent negative posts from becoming the next viral thing on TikTok.
The social listening market is big, and if you’re in digital marketing, you know that choosing the right social listening software today might determine how successful your marketing strategy will be tomorrow.
Beyond the number of social channels available and the options for tracking insights about your brand, competitors, and industry, you need a real-time, up-to-date social listening dashboard.
So, here’s a short list of what you should pay attention to, and why:
- Does it have a real-time, up-to-date social listening dashboard? Because you won’t have a second chance 12 or 24 hours later to react to a post from your unsatisfied customer. It’ll probably be too late. Mentionlytics offers continuous real-time updates for all Advanced and higher-tier plans.
- Can you share the dashboard with your team members, clients, or a specific department? That’s an important factor because social listening (when done right) can benefit multiple departments, from product development to sales.
- Can you combine data from your CRMs with social listening data? This is probably where you can feel the real power social listening has. Bringing social listening insights into your CRM dashboard lets you measure the impact of your marketing and PR efforts.
Mentionlytics combines these three with a Shareable Dashboard feature available on Business and Enterprise plans.
You can create a custom dashboard, choose which metrics and mentions it displays, and share it via a password-protected link with clients, colleagues, or other teams. Recipients don’t need a Mentionlytics account to explore the live data, and you decide whether they can use filters or Boolean search. Best of all, these dashboards update automatically as new mentions are being collected.
You can also embed the dashboard on your website via an iframe or add it to HubSpot and other CRM systems that support external content. This brings social listening insights, such as sentiment, customer feedback, trends, and share of voice, next to your existing marketing and sales data.

For agencies, there’s a white-label dashboard option that lets them tailor the displayed metrics for each client, giving stakeholders the insights they need without giving full access to their Mentionlytics account.
Generate Your Social Listening Report for Free Today
Wondering how to do a social listening report for free? We have a suggestion. Get your 14-day free trial with Mentionlytics, tune in to see how social listening works, and pull a report after one or two weeks of listening.
Social listening insights are already there. You just need a listening platform to summarize social data into one PDF and show you the direction your marketing and PR strategy should go.
FAQ
What is a social listening report?
A social listening report summarizes online conversations about your brand, product, campaigns, competitors, or industry. It includes metrics such as: number of mentions, reach, engagement, sentiment, share of voice, influencers, channels where conversations happened, your owned media reports, and, with advanced social listening platforms, actionable tips.
How can I report social listening?
Start by defining the purpose and audience of your social listening report, then select the metrics that support that goal. Use a social listening tool to collect and analyze mentions across relevant sources, compare the results with previous periods or competitors, and highlight important trends, sentiment changes, and conversation drivers. Finally, add a short summary of your findings and recommended actions.
