Behavioral analytics is crucial for business success, as it centers on customer satisfaction, an aspect often overlooked. Regardless of your marketing investment, it cannot rectify a subpar user experience (UX). So, crafting an outstanding customer journey is essential.
It not only identifies areas needing improvement but also highlights user preferences and behaviors. This insight allows for a more tailored approach, ensuring that every interaction with your product or service resonates positively with your customers.
By integrating these analytics into your strategy, you’re not just solving problems – you’re proactively creating a more engaging and satisfying experience for your users.
Let’s delve into how behavioral analytics strategies can enhance your user experience and significantly boost customer contentment.
Table of Contents
What Is Behavioral Analytics?
Behavioral analytics is a complex method for identifying how users engage with digital platforms, like social media, websites, and apps. It includes the gathering and examination of user data to gain valuable insights into their behavior.
Using behavioral analytics, businesses can make well-informed decisions aimed at enhancing their offerings, providing personalized experiences, and increasing user satisfaction.
Behavioral analytics cover various customer activities, including
- Monitoring reviews and customer feedback,
- Frequency and duration of website visits,
- Social Media Engagement,
- Email Interactions,
- Account creation activity,
- Form completion patterns,
- Subscription purchase behavior.
- Abandonment rates, etc.
By developing a stronger comprehension of the needs and preferences of your customers, you can provide them with greater value.
Why Is Behavioral Analytics Important for UX?
User interfaces that are truly amazing don’t happen by chance.
The most successful companies recognize that conducting user research is crucial for making more effective design decisions.
According to a report by Fortune Business Insights, the behavioral analytics market is expected to experience significant growth, increasing from $801.8 million in 2023 to an impressive $7,384.4 million by 2030.
This substantial increase highlights the growing acknowledgment of behavior analytics as a crucial tool for mastering user interactions.
Behavior analytics plays a crucial role in helping businesses analyze preferences and pain points. This valuable information then guides design decisions to enhance overall user satisfaction.
For example, by understanding how users search for specific product types on search engines, businesses can optimize their website design and promptly provide relevant information.
In essence, behavior analytics acts as a compass for UX designers, enabling them to tailor interfaces and content to meet user expectations, resulting in a more captivating and efficient user experience.
The source of the behavioral analytics insights you get to improve your UX is not just limited to your website. Your social media channels are another great way to hear feedback from your audience.
For example, An online clothing retailer combines social media monitoring with behavioral analytics to enhance its website, introducing personalized product recommendations and improving navigation.
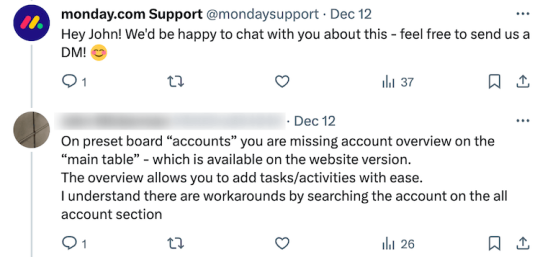
This strategy, informed by customer preferences and behaviors, results in a better user experience, increased sales, and stronger brand loyalty.
5 Steps to Improve UX with Behavioral Analytics
By focusing on pleasing your users at every stage of their journey, from signing up on your website up to the checkout process, you can greatly enhance their experience.
To achieve this, let’s explore key steps that will help you take your UX to new heights through behavioral analytics.
Step 1: Define Key Objectives and Metrics
Make sure to clearly define your goals and objectives when it comes to improving the user experience. Additionally, identify your brand KPIs or key performance indicators that are in line with your business goals and can be measured using behavioral analytics.
Step 2: Monitor All the Stages of the Customer Journey
The customer journey is a lengthy yet very important process, and it is essential to keep track of various stages of the journey from initial brand awareness to post-purchase behavior.
Let’s uncover some of the most important aspects below.
Landing Page Conversion Rates
Landing page conversion rates are a crucial element for boosting any digital product or service. The process of optimization of website conversion rate, or CRO is required to pave the way to success. This process involves examining user behavior, pinpointing possible obstacles, enhancing page elements like headings, images, and forms, performing A/B testing, and making enhancements based on data-driven insights.
Usability of Products
A user-friendly product is not only more likely to attract and retain customers but also contributes to increased satisfaction and loyalty.
Hence, product usability is a crucial factor for every web application and SaaS tool available. The best way to demonstrate your concern for the user experience is by identifying, monitoring, and resolving all the bugs that can affect your product’s usability.
For instance, if you own an e-commerce website and constantly monitor user behavior during the checkout process, you can easily notice where customers drop off and easily use those friction points to streamline the user journey.
Social Listening
Using social media listening tools at each stage of your monitoring offers real-time insights into customer sentiments, preferences, and pain points.
By analyzing social media interactions, brands can identify areas needing improvement in the customer journey, such as streamlining the checkout process or enhancing post-sale support.
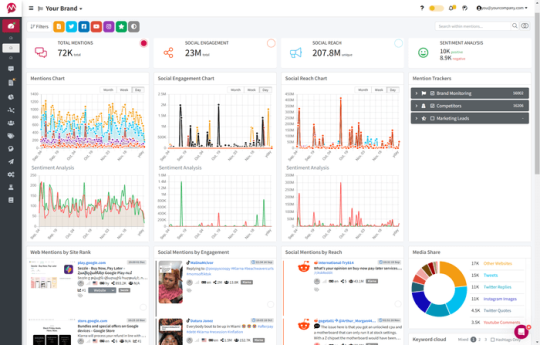
This comprehensive monitoring ensures a holistic approach to refining the user experience based on actual customer feedback and behaviors.
To try a social listening tool for free, sign up for Mentionlytics:
Marketing Metrics
Monitoring marketing metrics using behavioral analytics is essential to enhancing the user experience (UX). With metrics such as click-through rates (CTR) and conversion rates, you can gain a key understanding of how your audience navigates through various marketing channels.
Churn Rates
The churn rate is a marketing metric that calculates the proportion of customers who stop using a product or service within a certain timeframe.
Keeping this percentage low leads to more people using and sticking with your product.
On average businesses in the U.S. are losing $136 billion each year because of customer churn that could have been prevented.
A considerable portion of website drop-offs can be attributed to accessibility issues. To prevent customer churn or ensure that your business maintains a low churn rate, it is important to incorporate an accessibility audit for your website. The combination of accessibility audits and behavioral analytics is crucial for comprehending user behavior and taking proactive measures to create user-friendly environments that reduce churn and enhance overall user satisfaction.
Step 3: Apply Various Strategies and Approaches
As each stage of your product’s development requires a unique approach, it’s essential to look at user behavior from different angles.
Here are some key approaches for monitoring behavior and gathering crucial data.
A/B testing
A/B testing involves gathering actual customer experiences and behavioral analytics data from two distinct versions of a product, feature, or digital asset.
This method is ideal for evaluating the efficiency of landing pages, PPC ads, email campaigns, and new feature announcements.
By using A/B testing and experimenting with different UX/UI patterns, you can discover the optimum design that attracts people the most. Even a small adjustment like this has the potential to boost conversion rates.

Source: Cinch PR
Heatmapping
Heatmaps are used for visually displaying user interactions on a website, with warmer colors indicating increased activity levels.
For example, an e-commerce heatmap can show that users often interact with a particular product image. This information can help you optimize your layouts strategically, improving the user experience and increasing conversions using real-time interaction data.
Session Recording
Session recordings document the user’s activities on your website, including clicks, scrolls, mouse movements, and keystrokes, offering a comprehensive playback of the entire session. This information allows you to detect which parts of the interface could benefit from enhancements.
User Feedback
User feedback can serve as an invaluable means for enhancing products or services. By examining user interactions with feedback, you can gain a comprehensive understanding of customer preferences, pain points, and areas of concern.
For instance, monitoring user behavior on a website using customer feedback tools can help identify navigation difficulties, enabling developers to enhance the website’s usability.

Source: @mcdonals
Step 4: Analyze the Data
Analyzing data and identifying patterns using behavioral analytics is crucial for enhancing the user experience.
This process includes exploring the collected data, using statistical analysis, and utilizing AI tools and machine learning algorithms.
This detailed examination uncovers valuable insights like user preferences, issues, and opportunities for enhancement.
For example, by employing social media analytics tools, brands can effectively track social mentions related to their platform and scan for negative comments and feedback to find any pain points.
This allows them to quickly address any emerging issues or dissatisfaction, turning potential negatives into opportunities for improvement and demonstrating responsiveness to customer needs.
Step 5: Evaluate the Outcomes
Whenever you make changes and enhancements, go to the analytics tool and observe the results.
You’ll be able to see the impact right away, allowing you to address any unexpected outcomes quickly. If the user experience is improving as planned, you can then concentrate on resolving issues in other areas that you have identified.
Final Notes
Now that you have all the essential information, you’re ready to take your website’s UX to the next level.
Put in the effort to improve both your product and user experience, creating a community of devoted customers who not only have faith in your product but also actively back it up.
Remember this when launching new products or introducing new features, using all the available analytics to carefully polish the overall user experience.
To get insights to improve your customer relationship using behavioral analytics, try monitoring social media for free, by signing up for Mentionlytics.