
Share of Voice (SOV) has always been one of the main metrics marketers and PR professionals use to measure brand awareness and, most importantly, brand potential. From our discussions with clients, we can confirm that this metric plays a significant role not only in determining whether a PR or advertising campaign worked well by reaching people but also in proving the trajectory of a brand.
There’s a direct correlation between SOV and the more traditional word-of-mouth, so that’s why most in-house and agency teams rely on it to showcase their work’s long-term impact.
In this article, we explain what Share of Voice is, how it differs from Market Share, how to calculate it manually and automatically for social media, PPC, SEO, and PR, and how successful brands use Share of Voice analysis to stay ahead of the competition.
Table of Contents
What Is Share of Voice (SOV)?
Share of Voice (SOV) is a marketing metric that measures how visible your brand is compared to your competitors across a specific channel, market, or industry. In simple terms, it answers one question: Out of all the conversations happening around your industry, how many are about your brand?
That’s why Share of Voice is one of the most valuable competitor analysis metrics available. It helps you understand which competitors are gaining attention, where conversations are happening, and whether your marketing efforts are actually increasing your market presence.
Historically, Share of Voice was used primarily in advertising. Marketers measured how often their ads appeared in print publications, television, radio, and other paid media channels compared to competitors through PR clipping.
Today, that’s only one part of the picture.
Modern Share of Voice analysis goes far beyond advertising exposure. Thanks to social listening software, media monitoring tools, and SEO analytics, brands can measure their visibility across social media, news websites, blogs, forums, review sites, podcasts, videos, and search engines.
And in 2026, there’s another layer to consider: The brands that dominate online conversations are often the same brands that appear most frequently in AI-generated answers. While Share of Voice is not the only factor influencing AI brand mentions, a strong digital presence creates more opportunities for AI systems to discover, understand, and reference your brand. And you should measure share of voice in AI search, but that’s beyond the scope of this article.
We stick to the broader SOV as a metric for different marketing reporting needs. So, that’s why companies no longer use Share of Voice simply to measure awareness. They use it to evaluate market positioning, online authority, dominant sentiment, customer engagement, media presence, and competitive performance.
Different Types of SOV
Depending on your goals, you can measure different types of SOV, including:
- Paid Share of Voice: Your visibility across paid advertising channels such as Google Ads, display ads, social ads, and sponsored placements.
- Organic Share of Voice: Your visibility in unpaid channels, including search engine rankings, organic traffic, and content performance.
- Earned Share of Voice: Mentions and discussions generated by customers, influencers, reviewers, communities, and third parties.
- PR and Media Share of Voice: Coverage your brand receives in news outlets, industry publications, podcasts, and media channels compared to competitors.
- Social Media Share of Voice: Your share of conversations across social platforms.
You don’t have to be a marketing wizard to figure out the impact of SOV on your brand’s positioning (which ultimately affects your sales). For example, the stats show that for the furniture retailers market, ASHLEY FURNITURE has 21.30% of digital SOV, and it’s not surprising to see that, at the same time, this retailer takes the biggest market share of 11%.
The specific metric may change, but the principle remains the same: the larger your share of the conversation, the harder it becomes for competitors to ignore you.
Take the Lead in Share of Voice
Track your Share of Voice with Mentionlytics and see how you compare to your competitors.
Share of Voice vs. Share of Market
Share of Voice (SOV) and Share of Market (SOM) are often confused because both measure your position against competitors. However, they track two very different things.
| Share of Voice (SOV) | Share of Market (SOM) | |
| What it measures | Brand visibility and attention | Revenue and market position |
| Main question | “How much are people talking about us?” | “How much are customers buying from us?” |
| Data sources | Mentions, social media, news, blogs, reviews, search visibility, PR coverage | Sales revenue, customers, market reports |
| Used by | Marketing, PR, SEO, brand teams | Executives, sales, finance teams |
| Example | Your brand receives 25% of all industry mentions. | Your company generates 12% of industry revenue. |
Share of Voice measures attention. Share of Market measures revenue.
In other words, SOV metrics tells you how much of the industry conversation belongs to your brand, while Share of Market tells you how much of the industry’s sales belong to your business.
Think of it this way: if your brand receives 30% of all mentions in your industry but generates 15% of total industry revenue, your Share of Voice is larger than your Share of Market. This is often a positive sign because it suggests your brand is gaining visibility faster than its current market position.
In fact… there is an interesting concept that says your Share of Voice should always exceed your Market Share. This concept, called Excess Share of Voice (ESOV), is supported by studies from the Ehrenberg-Bass Institute and Nielsen, and seems especially important for B2B brands.
What Is Excess Share of Voice (ESOV)?
Share of Voice becomes even more useful when you compare it to your Share of Market. The difference between the two is called Excess Share of Voice (ESOV):
For example, if your brand owns 20% of industry conversations but only 12% of industry revenue, your ESOV is +8%.
The concept became popular thanks to marketing effectiveness researchers Les Binet and Peter Field, whose work explored the relationship between brand visibility and long-term growth. Their research found that brands that consistently maintain a positive ESOV often create better conditions for increasing market share over time.
Of course, ESOV is not a guarantee of growth. Product quality, customer experience, pricing, and market conditions still matter. However, a positive ESOV is generally considered a healthy signal because it suggests your brand is generating more visibility than its current market position would suggest.
That’s why many marketers don’t focus on achieving a specific Share of Voice percentage. Instead, they focus on increasing Share of Voice faster than Share of Market, creating positive ESOV and giving their brand more room to grow.
Why Measuring Share of Voice is Important in 2026?
It was always important, but nowadays it has become essential if you want insights that could speed up your brand’s visibility. So, let’s see why it’s becoming one of the most valuable social metrics and why you should measure your share of voice. Here are 8 use cases where tracking your Share of Voice helps you.
Shows Signals of Authority Your Brand is Sending to LLMs
The brands that consistently appear in articles, reviews, discussions, podcasts, forums, and social media conversations are more likely to be discovered and referenced by Large Language Models (LLMs).
Measuring Share of Voice helps you understand whether your brand is visible enough to be included in those recommendations. Ahrefs conducted a study on factors impacting AI Overview visibility, and branded mentions had the highest correlation coefficient (0.664), well above URL rating (0.18).
So, using a social listening tool to measure Share of Voice gives you a hint at your chances to show up in the AI Overview.
Identifies the Channels Where You Are Winning (or Losing)
Your brand may dominate discussions on LinkedIn while being virtually invisible on Reddit. Or you might own social conversations but have little media coverage. Share of Voice analysis helps uncover where your visibility is strongest and where competitors are outperforming you.
This matters because not all channels contribute equally to brand growth. A competitor may have fewer overall mentions than you, but dominate the platforms where your buyers actually spend time. By breaking down Share of Voice by channel, you can identify where your audience is most engaged, where your content resonates, and where competitors are gaining attention that could have been yours.
You’ll need social media analytics tools to do that, because doing it manually, there’s a good chance you’ll miss important insights. There are way too many channels to analyze, the process is time-consuming, and the environment is changing too fast.
And you need accurate, up-to-date channel-level Share of Voice to make smarter marketing decisions. Instead of spreading resources across every platform, you can focus on the channels that generate the most visibility, engagement, leads, or brand authority. Whether it’s social media, news sites, blogs, forums, podcasts, review platforms, or AI search results, understanding where you are winning (and where you’re not) allows you to allocate your budget and efforts more effectively.
Provides Valuable Audience Insights
Your audience is constantly sharing opinions, tips, complaints, thoughts, experiences, and recommendations online. And that’s one of the most genuine pieces of feedback you can get. By tracking SOV across multiple platforms, you can get valuable audience insights, such as:
- what markets your brand dominates
- the overall sentiment (positive or negative)
- if the audience is more into your competitors or your brand
- what channels your audience uses the most
- what causes the negative sentiment
Knowing your core audience better helps you perform more targeted social media and digital marketing efforts.
Analyzing your audience’s online behaviors and key demographics helps you understand which type of content best fits your brand. And if you pair this information with a free AI content-writer tool, you can speed up your content creation and nurture your audience with the topics they really care about.
SoV helps businesses turn their casual audience into passionate brand communities that see their interests and values reflected in the brand.
Helps You Measure Whether Your Marketing Is Actually Working
Every marketing team wants more visibility. The problem is that many brand awareness metrics only tell part of the story.
Your website traffic may increase, social media engagement may improve, your latest campaign may generate thousands of impressions, and your YouTube channel might gain thousands of new subscriptions. But are these efforts helping you capture a larger share of the industry’s attention? No, they are just metrics for performance in isolation.
Share of Voice measures your visibility relative to competitors. If your campaigns are successful, your Share of Voice should grow. If competitors are gaining attention faster than you are, your Share of Voice will reveal that as well.
In other words, Share of Voice answers a question that many marketing metrics can’t answer: Are we actually gaining ground, or are we simply keeping pace with our competitors?
Helps You Benchmark Competitors and Find Market Gaps
One of the most practical uses of Share of Voice is identifying who dominates industry conversations and understanding why.
For example, when Videojet, a global leader in industrial coding and marking solutions, started tracking Share of Voice with Mentionlytics, the goal wasn’t simply to count mentions. The company wanted to understand how its visibility compared to competitors, which topics generated the most discussion, and where opportunities existed to strengthen its market presence.
By monitoring industry conversations and competitor activity, the team gained a clearer picture of its competitive landscape and could make more informed marketing decisions.
Melis Celebi, Global Brand Manager at Videojet Technologies
This is where Share of Voice becomes a competitive intelligence tool rather than a reporting metric, because it answers the question: “Why is our competitor getting more attention, and what can we learn from it?”
Don’t Waste Your Time on Things That Don’t Count
With the Mentionlytics Share of Voice dashboard, you can understand what your audience truly cares about, what the market gaps are, and how to make your brand stand out.
Helps You Measure the Impact of PR Campaigns
Getting featured in a major publication feels like a win, but what happens after the article is published? Did it increase brand visibility? Did more people start talking about your company? Did it help you stand out from competitors?
Share of Voice helps answer those questions.
By measuring your share of industry conversations before, during, and after a PR campaign, you can see whether your media coverage translated into greater visibility. If your Share of Voice increases following a product launch, funding announcement, thought leadership campaign, or major media placement, that’s a strong indication that your message is reaching the target market.
Helps You Prove Market Position to Stakeholders and Investors
Share of Voice isn’t just a marketing metric. It can also serve as evidence of brand momentum, market presence, and competitive positioning.
When brands are growing, investors, executives, and board members often want answers to questions such as: “Are we becoming more visible?”, “Are we gaining ground against competitors?”, “Are people talking about us more than they were six months ago?”
This is exactly how ContentCal used Share of Voice data through Mentionlytics. By tracking brand mentions, sentiment, and competitor visibility, the company gained a clearer understanding of its position within the social media management market. The insights helped demonstrate growth and market relevance, ultimately supporting strategic decision-making during a period that culminated in Adobe’s acquisition of the company for $100 million.
“We did this in the early days. It got one of our investors hungry straight away because I just put our competitor in Mentionlytics (…) and then showed where our tiny little Share of Voice was at that point. I was like, “The reason we’re not growing as quickly as we want to right now is because everyone’s talking about Hootsuite. We need to change that.”
Andy Lambert, Principal Product Manager at Adobe
For growing SaaS companies, startups, and scale-ups, Share of Voice can become a powerful metric for communicating brand growth when revenue alone doesn’t tell the full story.
Helps You Protect and Manage Your Brand Reputation
Building a strong brand takes years. Damaging it can take a single viral post. That’s what’s making brand reputation management so challenging today.
According to the 2025 Edelman Trust Barometer, 88% of consumers say trust is just as important as price and product quality when deciding which brands to buy from. In other words, reputation has become a business metric.
Monitoring your share of industry conversations helps you understand not only how visible your brand is, but also whether that visibility is positive, negative, or changing unexpectedly.
For example, a sudden spike in brand mentions might look like good news at first glance. But once you dig deeper with brand monitoring tools, you may discover customer complaints, negative press coverage, a product issue, or a controversial statement that is generating unwanted attention. The earlier you identify these shifts, the faster you can respond, adjust your messaging, and prevent a small issue from becoming a full-scale reputation crisis.
And if 2026 has taught us anything, it’s that your reputation now follows your brand everywhere: social media, Reddit, review sites, news outlets, and even AI-generated answers. Share of Voice helps you understand how visible your brand is across those channels, what the sentiment of these conversations is, and how your brand’s reputation compares to your competitors’.
How to Calculate Share of Voice?
The good news? The formula behind Share of Voice is surprisingly simple. The less good news? The metric you use depends on what you’re trying to measure.
For example, social media Share of Voice is usually based on mentions, while SEO Share of Voice relies on search visibility and keyword rankings. PPC often uses impression share, and PR focuses on media coverage and brand mentions.
General Share of Voice (SoV) Formula
Regardless of the channel or type, the underlying Share of Voice formula remains the same:
In other words, you’re measuring what percentage of the total conversation, visibility, or attention belongs to your brand compared to competitors.
At this point, you might be wondering where those “total market metrics” come from.
In practice, most companies don’t calculate Share of Voice across an entire industry. Instead, they measure it against a selected group of competitors. For example, if you’re tracking your brand alongside four competitors, the total number of mentions, impressions, media articles, or AI appearances across those five brands becomes your market total.
That’s also why most marketers use media monitoring tools to calculate Share of Voice automatically. The formula itself is simple, but the challenge is collecting and aggregating the data.
No Time to Do the Math?
No problem! Use Mentionlytics to automatically measure your brand’s Share of Voice!
What is a Good Share of Voice Percentage?
There’s no universal answer. A 15% Share of Voice might be outstanding in a crowded market with dozens of competitors, while the same share could be disappointing in a niche where only a handful of brands compete.
That’s why Share of Voice is best used as a competitive benchmarking metric rather than a standalone KPI. Instead of asking, “Is 20% good?”, ask:
- Is our Share of Voice growing?
- Are we gaining ground on competitors?
- Do we own a larger share of the conversation than we did six months ago?
- What’s our SoV compared to SoM?
Those answers are usually much more valuable than the percentage itself.
Social Media Share of Voice
Social Media Share of Voice measures how often the audience mentions your brand compared to competitors across social platforms.

The formula is the following:
Social Media SoV = (Number of brand mentions ÷ Total number of industry or competitor mentions) x 100
If you wanted to measure your social media engagement, you’d replace the number of mentions with the total number of likes, comments, and shares.
With Mentionlytics, you can calculate this automatically since the platform is collecting mentions for your brand and your selected competitors without needing you to press a button.
Can You Calculate Social Media Share of Voice Manually?
Yes, although it becomes difficult as the number of competitors and social media platforms grows. But here are the steps:
- Pick a timeframe (7 days or a month).
- Choose 2 competitors (you can choose more, but remember you’re going to repeat the process for each).
- Count the tags (mentions) and their hashtag appearances. Go to Instagram, TikTok, or LinkedIn. Search your brand’s unique hashtag or tagged section, and write down how many new posts appeared this week. Do the same for your competitors.
- Do the math: If your brand had 20 posts, Competitor A had 50, and Competitor B had 30, the total industry mentions would equal 100. Your Social SOV is 20%.
SEO Share of Voice
SEO Share of Voice measures how visible your brand is in organic search compared to competitors. Modern SEO tools don’t simply count rankings. Instead, they calculate visibility using keyword rankings, search volume, estimated traffic, and SERP presence across a selected keyword set.

The formula is the following.
SEO SoV = (Number of SERP features for you ÷ Total number of SERP features for your industry or competitors) x 100
Tools like Ahrefs and Semrush calculate this automatically, allowing you to benchmark your search visibility against competing domains.
Can You Calculate the Share of Voice for SEO Manually?
To a degree, yes. One of the simplest methods is to create a keyword list and compare ranking positions across competitors.
- Create a list of your most important keywords.
- Search each keyword in an Incognito browser window.
- Record where your website and competitors rank.
- Assign points to each ranking position (for example, 10 points for position #1, 9 points for position #2, and so on).
- Add up the scores and calculate each brand’s percentage of the total. While this won’t be as accurate as professional SEO tools, it can provide a rough estimate of your search visibility relative to competitors.
PPC Share of Voice
In paid advertising, Share of Voice is commonly known as Impression Share.
Google Ads calculates this metric automatically under the Impression share, by comparing the number of impressions your ads received with the total number of impressions they were eligible to receive.

PPC SOV = (Your Ad Impressions ÷ Total Eligible Impressions) × 100
A growing share of paid advertising often indicates stronger visibility and a more competitive advertising presence.
PR Share of Voice
PR Share of Voice measures how much media coverage your brand receives compared to competitors.
Media monitoring tools calculate this by tracking brand mentions across news sites, industry publications, blogs, podcasts, interviews, and other media sources.

PR SOV = (Your Media Mentions ÷ Total Media Mentions Across Competitors) × 100
This metric is particularly useful for PR teams measuring the impact of PR campaigns, thought leadership initiatives, product launches, and brand awareness efforts.
Can You Calculate PR Share of Voice Manually?
Yes, especially if you’re tracking a small number of competitors:
- Choose a timeframe (for example, the last month).
- Search your brand and competitors in Google News.
- Count the number of articles mentioning each brand.
- Add all media mentions together.
- Calculate the percentage each brand owns.
For example:
- Your brand: 30 articles
- Competitor A: 45 articles
- Competitor B: 25 articles
Total media coverage: 100 articles.
Your PR Share of Voice = (30 ÷ 100) × 100 = 30%
This method is commonly used in small-scale PR research, although media monitoring platforms make the process significantly faster and more accurate.
Get your PR Share of Voice as Quick as Possible
Mentionlytics made it simple, budget-friendly, and reliable.
How to Conduct a Share of Voice Analysis with Mentionlytics?
So let’s say you need a quicker, easier, and more reliable way to do a SoV analysis, and you picked Mentionlytics as your preferred social listening tool for online (web) and social media Share of Voice. Let us show you how simple and automated the process is.
First: Set Up Share of Voice
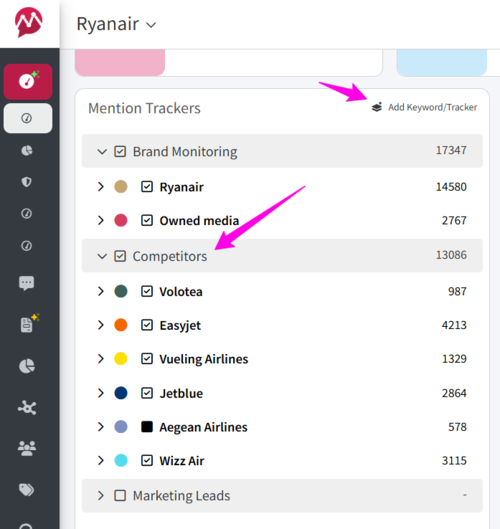
Measuring Share of Voice requires you to monitor at least one of your competitors. To add competitors from the Mention Trackers box, just use the + Add Mention Keyword/Tracker button.
Just make sure both your owned media and your competitor media are checked before you look at your SoV dashboard.
Best Way: Go to Share of Voice Dashboard
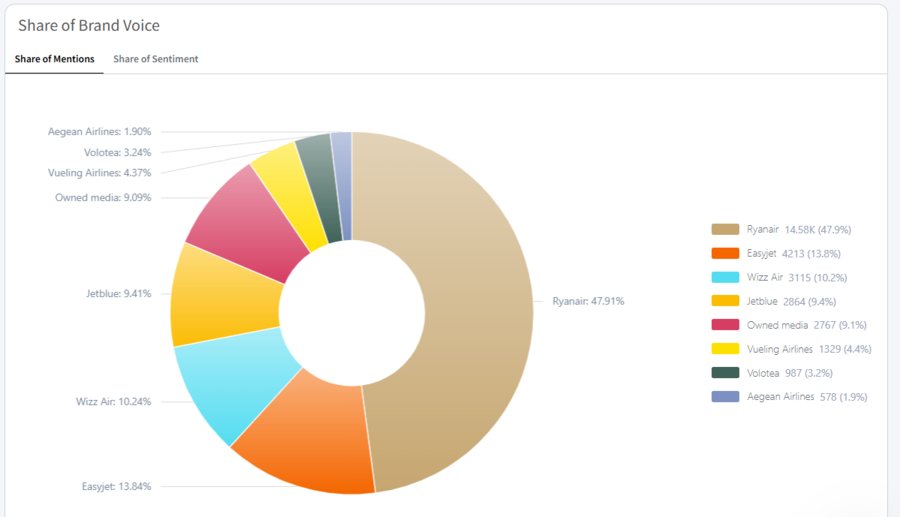
Now that you’re all set, go to the left-side menu and click “Dashboards” to open the drop-down menu, and you’ll see the Share of Voice. Click on it, and it will take you to the SoV dashboard.
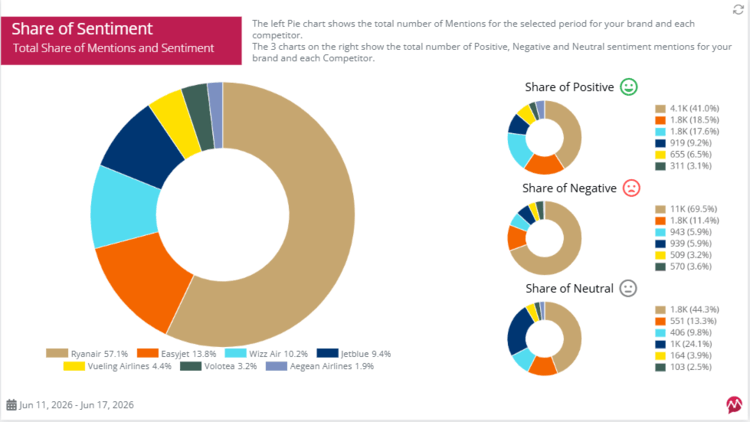
Once your SoV dashboard opens, you’ll see a pie chart showing the percentage of mentions for you and your competitors.
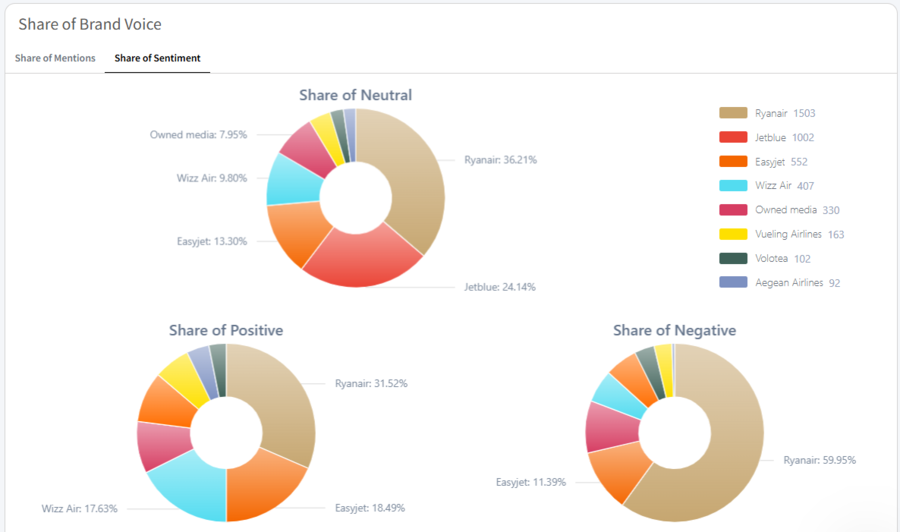
In the same chart, you can also check your sentiment share (positive, negative, neutral).
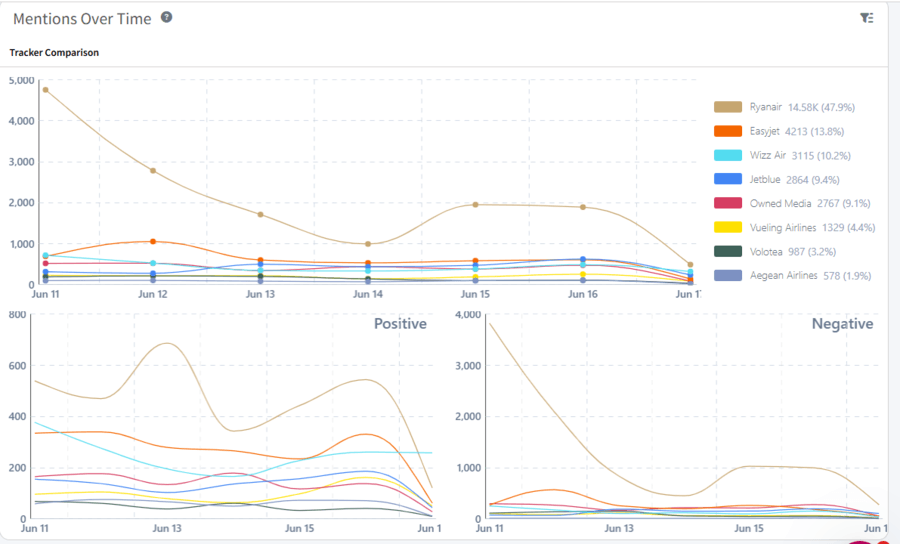
Depending on what chart you choose, the chart below with daily/weekly/monthly/quarterly/yearly tracking charts will dynamically change.
Besides these two charts, you can find a very useful feature, called Top Daily Topics, where you can see the hot topics around your brand.
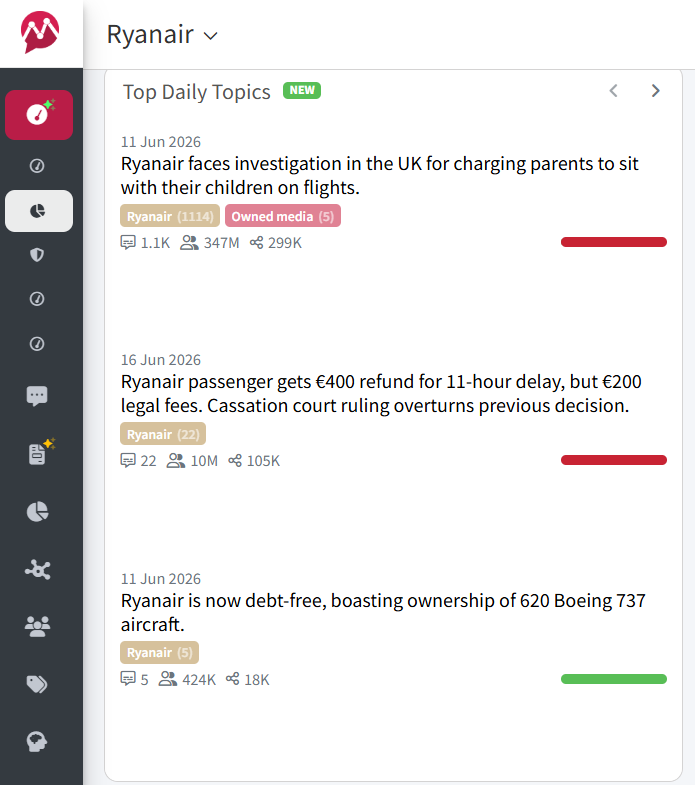
As you can see in the example screenshot above, on June 11th, 2026, the hot topics for Ryanair were predominantly negative, concerning the UK investigation into an extra charge for parents sitting by their children and a refund, with one positive topic being that they are now debt-free.
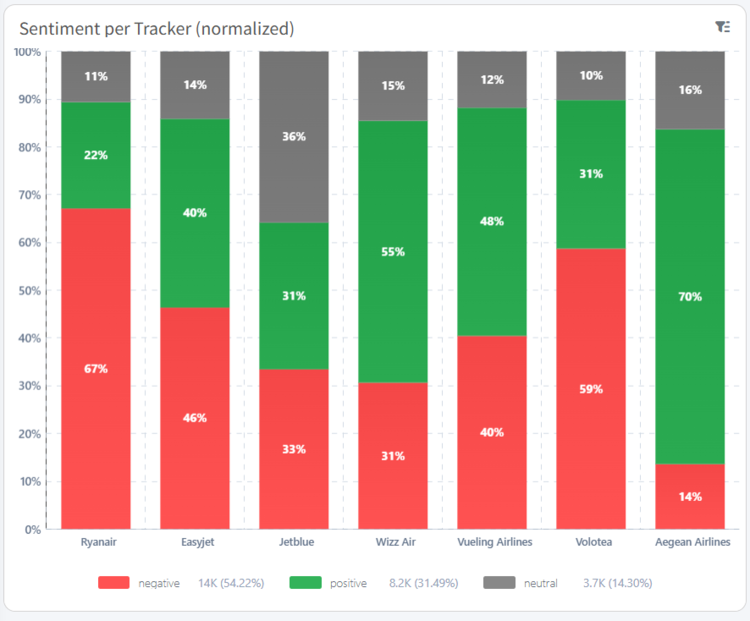
Scrolling down, you can find the Sentiment by Tracker chart, which will show you the sentiment (positive, negative, neutral) for each of your competitors.
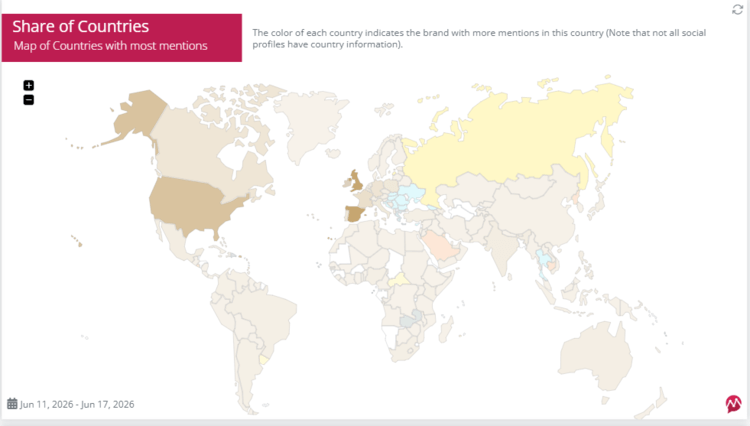
And if you want to find out where your brand is most mentioned geographically, you should check the World map.
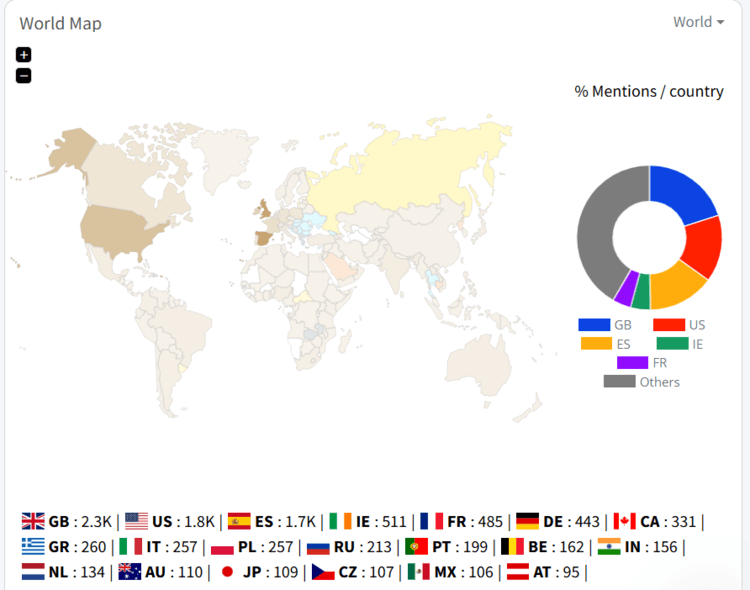
This interactive chart has one more benefit. If you’re focused on one specific market, you can filter (choose) a specific country and see where you stand against your competitors in terms of SOV for that country.
At the bottom of your Share of Voice dashboard, you can find the most relevant mentions divided into three groups:
- Social media by engagement
- Owned media by engagement
- Web and news by rank
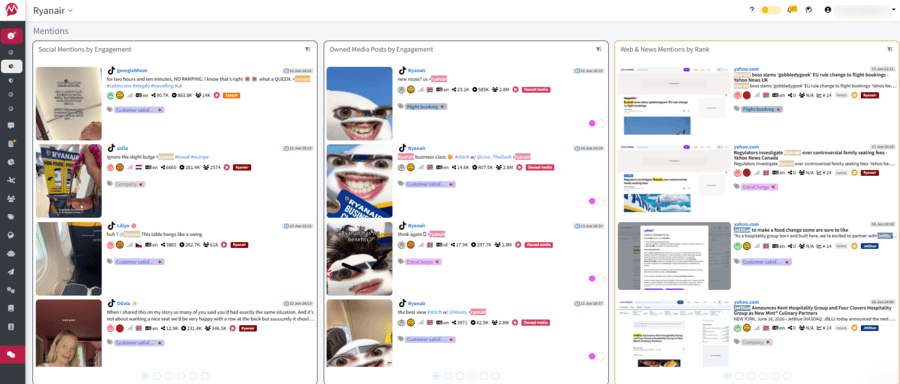
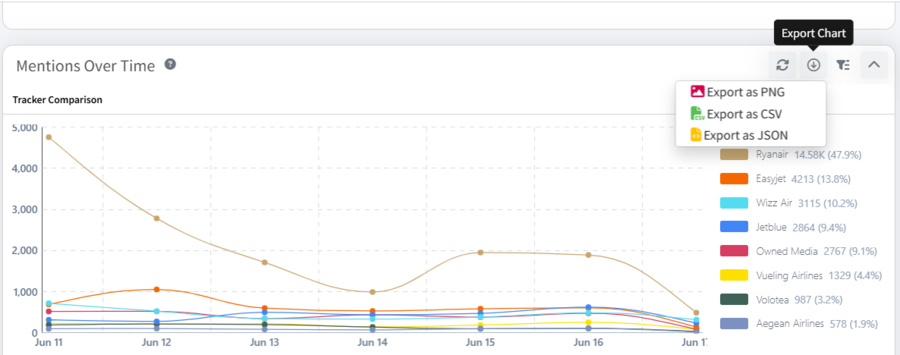
Finally, you can download your SoV graph as a PNG image using the Export button on each chart, and you can download it as a PDF, CSV, or JSON file.
Alternative Way: Go to Share of Voice Report
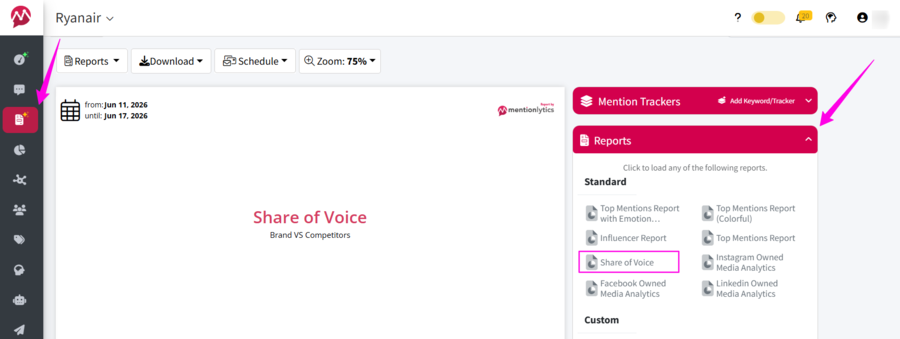
Now, if you don’t want to manually pull each chart, but you want an automated report, you can click on the Reports within the left-side menu, and then choose the Share of Voice within the Reports tab on the right side.
The report consists of 6 segments:
- Cover slide
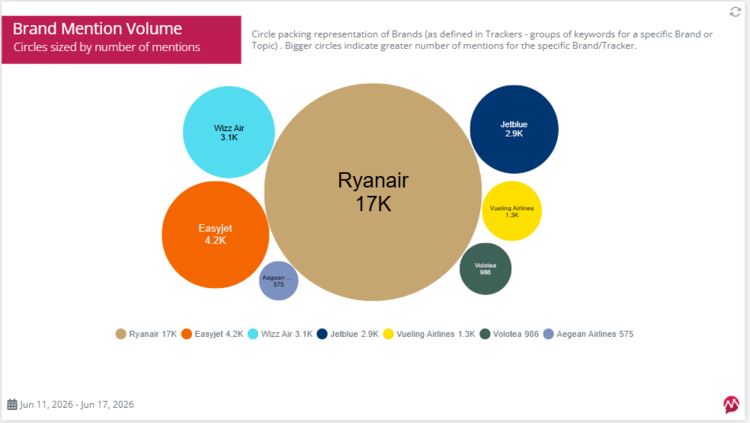
- Brand mention volume
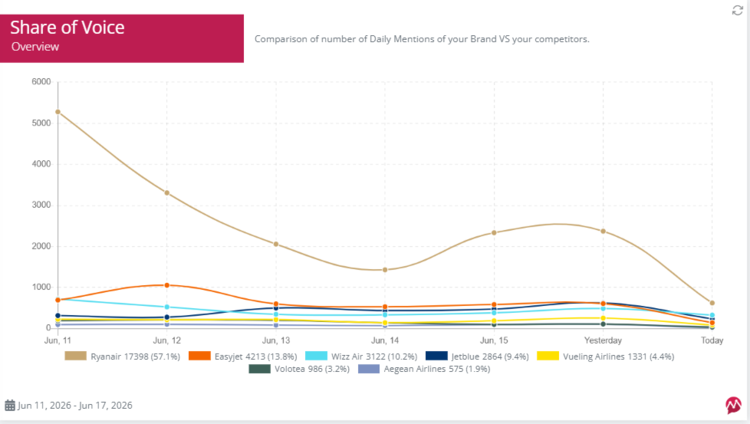
- SoV graph
- Share of sentiment pie charts
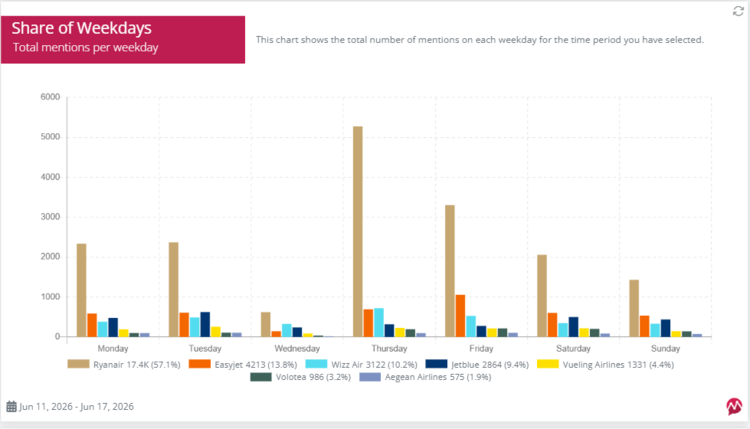
- SoV by weekdays chart
- SoV by country
Now, this is a standard report, but you can customize it easily if you have a higher-tier plan, make it your own, fully white-label, or choose the elements of the report you want to present.
Want to check it yourself?
You can experiment with Mentionlytics’ 14-day free trial and craft your own SOV report in no time.
Find Out What’s Your SoV
With Mentionlytics, you can track your Share of Voice across social media, news sites, blogs, reviews, forums, podcasts, videos, and the web while benchmarking yourself against competitors and analyzing sentiment in real time. Because in 2026, the brands winning the market are usually the brands winning the conversation first.
The only question left is: How big is your slice of the pie?
FAQ
How can I measure share of voice?
The easiest way to measure Share of Voice is with a social listening or media monitoring tool. Simply add your brand and competitors, and the platform will calculate what percentage of the conversation belongs to each brand. You can also calculate SOV manually by counting mentions, media coverage, keyword visibility, ad impressions, or AI appearances and applying the standard formula: Share of Voice = (Your Brand Metrics ÷ Total Competitor Metrics) × 100
What is a good share of voice percentage?
There is no universal benchmark. A 10% Share of Voice may be excellent in a crowded market, while 30% could be disappointing in a niche with only a few competitors. The most important thing is not the percentage itself, but whether your SOV is growing over time and whether you’re gaining ground on competitors. Many marketers also compare Share of Voice to Share of Market through Excess Share of Voice (ESOV) to understand whether their visibility is creating conditions for future growth.
What is share of voice as a KPI?
Share of Voice is a competitive visibility KPI that measures how much of the conversation, attention, or market presence your brand owns compared to competitors. Companies use it to evaluate brand awareness, PR performance, marketing effectiveness, competitor positioning, reputation management, and increasingly, AI visibility. A growing SOV often indicates that your brand is becoming more visible and influential within its market.