Ah, that return on investment… evergreen question every business owner asks. “How much is it going to cost me, and what results can I expect?” Legit, if businesses don’t have the results they hope for, then all the marketing efforts seem wasted.
So, how do we measure social media ROI? Is there a formula you can use once you set KPIs to calculate return on investment?
Social media marketing is a long game — results don’t always appear overnight. It’s often like walking through the fog; you might not see the impact right away, but if you stay consistent, the path (and the results) will eventually become clear.
Every marketer knows that. However, this definition will probably not satisfy business owners and stakeholders.
The cure exists, ROI exists, and your social media efforts are measurable! It only depends on what kind of results you expect, tangible or intangible, and whether you refer to paid or organic social media campaigns.
Let us show you what KPIs and formulas you can use to measure social media ROI, how to present your social media campaign in a business owner’s language, and what the expected results are.
Table of Contents
Social Media ROI Explained & Formula to Calculate
Social media ROI can be defined as the value a business gets from social media efforts compared to the invested resources (time, money, effort). It answers a simple question, “Was the money, time, and resources spent on social media campaigns worth it?”
Return on Investment (ROI) is a percentage calculated by subtracting the investment cost from the return, dividing the result by the investment, and multiplying by 100. The social media ROI formula looks like this:

Generally, Return refers to revenue, but in social media marketing, it is not always direct profit. It can also be intangible benefits, such as:
- Sales & Conversions (E-commerce purchases, lead generation)
- Brand Awareness (Increased followers, shares, mentions)
- Customer Engagement (Comments, likes, interactions)
- Website Traffic (Click-through rates, time spent on site)
- Customer Loyalty & Retention (Repeat purchases, positive reviews)
Just as return varies, investment is not just about money — it includes everything you put into social media efforts, such as:
- Ad Spend – Paid promotions on platforms like Facebook, Instagram, and LinkedIn
- Time & Effort – Content creation, community management, engagement strategies
- Content Production Costs – Designing graphics, videos, and copywriting
- Software & Tools – Social media management, scheduling, analytics, and automation tools
- Team Salaries or Freelancer Fees – Costs of managing and executing campaigns
By evaluating both return and investment, businesses can calculate social media ROI and assess whether their marketing strategies are truly paying off.
Social Media ROI Examples
Let’s see what ROI looks like in real-life situations and industries, depending on the objectives (KPIs) a company wants to track.
A 2021 study showed that the five most used (or preferred) KPIs in digital marketing for measuring social media performance are:
- Engagement rate
- Efficiency
- Inbound
- Conversion
- Reach
We’ve chosen three of them to showcase how to measure the ROI of your digital marketing campaigns and social media efforts.
1. Engagement (Likes, Shares, Comments) as KPI
Let’s assume a fitness brand launches an Instagram hashtag challenge (#30DayFitnessChallenge) to boost interaction.
- Costs (Investment):
- Content creation (videos, graphics): $1,000
- Paid promotion (boosting posts): $800
- Total Investment: $1,800
- Gains (Engagement Value):
- Total engagement: 30,000 likes, 5,000 comments, 8,000 shares.
- Value per engagement: You can use the average Instagram cost per engagement (CPE), which in February 2025 is $0.061 to calculate the value by multiplying it by total engagement.
- Total engagement value = (30,000+5,000+8,000)x$0,061=$2,623
- Costs (Investment):
ROI Calculation:
ROI = ($2,623 − $1,800) / $1,800 × 100 = $823 / $1,800 × 100 = 45.72%
2. Conversion as an Objective
Though it’s not among the top three choices for marketers, conversion is probably the #1 metric the sales team considers.
So, let’s see how to calculate social media Return on Investment if a KPI is a conversion. It’s directly tied to sales, so it makes it easier to quantify.
We’ll take as an example an e-commerce store that runs Pinterest ads to promote a new jewelry collection.
- Costs (Investment):
- Ad spend: $3,000
- Photoshoot/design: $1,200
- Total Investment: $4,200
- Gains (Revenue from Conversions):
- Conversions (purchases): 150 sales
- Average order value (AOV): $80
- Total revenue = 150×$80=$12,000
ROI Calculation:
ROI = ($12,000 − $4,200) / $4,200 × 100 = $7,800 / $4,200 × 100 = 185.7%
3. Objective: Reach
For the last example, we’ll show you how to calculate ROI for Reach as an objective. A nonprofit runs a Facebook campaign to raise awareness about a climate initiative.
- Costs (Investment):
- Video Production (Filming & Editing): $800
- Infographic Design for an Educational Post: $300
- Community Engagement (Social Media Manager’s Time): $400
- Total Investment: $1,500
- Gains (Reach Value):
- Total Impressions: 1,500,000 (from viral TikTok videos and user engagement)
- Estimated value of impressions: Using Facebook ads, the average click per 1000 views (CPM) for 2025 ranges from $1.01 to $3,00 – Average: $2)
- Value of 1.5M impressions = (1,500,000/1,000)×$2=$3,000.
ROI Calculation:
ROI = ($3,000 − $1,500) / $1,500 × 100 = $1,500 / $1,500 × 100 = 100%
What is a Good ROI in Social Media?
If you’re wondering which social media platform would be best for your marketing campaign, let us remind you that the first thing you have to look at is whether your audience is on that platform. This will directly influence your social ROI.
That’s why there is no black-and-white sheet for ROI. However, according to marketers, YouTube is the best social media for ROI, followed by Facebook, Instagram, TikTok, X, and LinkedIn, which share fifth place.
Whatever platform you choose, if you want to compare your results, keep in mind that what’s considered a good ROI in social media is two to three times the investment. That means your ROI shouldn’t be less than 200%.
2 Smart Ways to Measure Social Media ROI
Okay, there is not much creativity in calculation (meaning there aren’t too many different ways to get results). But we can say it’s slightly different when your KPI is measurable, once it’s not, and if you’re measuring paid ads or organic social media.
So let’s see how you can measure your ROI on social media for ads and organic efforts.
Calculating Social Media Advertising ROI
Social marketing strategy almost always includes paid ads, and when you want to see how successful your campaign was or to predict its effects (to explain to the business owners what they can expect out of your campaigns), you need to calculate ROI.
Since Facebook and Instagram have the highest ROI, no wonder they are the first choices for most marketers.
The calculation is based on the universal formula:

Revenue from the campaign could be trackable sales, leads, or conversions directly attributed to the campaign.
While total investment encompasses:
- Ad spend – budget allocated to the platform
- Creative costs – content creation (videos, copywriting, visuals)
- Tools – analytics tools and management platforms
- Labor – time spent by your team managing the campaign
Tools to Use
Besides the statistics from the platforms used for social media advertising, such as Meta Business Suite (when it comes to Facebook and Instagram) and Google Analytics, you can also use some CRM platforms, such as HubSpot, Salesforce, or any others that suit your needs for tracking additional metrics.
Measuring ROI from Organic Social
When it comes to measuring ROI from organic social media, things get tricky. Unlike paid ads, where you can track every click and conversion, organic social includes intangible results that are hard to pin down.
You can’t precisely measure the impact of a single post — your customer might see your content on Instagram today, Google your business next week, and finally make a purchase a month later.
And unless you’re running surveys (a whole different topic), you won’t have direct proof of what drove the decision.
But there is a solution for organic social measurements. You can use social listening to learn more about how your potential buyers perceive your brand, how they feel about it, how much they talk about your brand online, and what they say about your competitors.
You can use the volume of mentions as your KPI to track awareness and their sentiment to identify shifts in your reputation (the more positive mentions, the better your brand is perceived).
Besides the proxy metrics used to measure your website traffic for socials, you can always assign $ to intangibles or tap into Share of Voice to benchmark against competitors.
Tools to Use
To make this organic ROI calculation doable, you’ll need a social listening tool, such as Mentionlytics, and you can use native analytics on the social media platforms you use, but also don’t step away from using CRM platforms as well (where you can create a form with a question where they learned about your brand, and give them the options.)
Best Metrics for Tracking Social Media ROI
No, it’s not the end, we’re just at the beginning of the ROI tale. As you might have guessed, there are different metrics for you to track depending on whether your campaign is paid or organic.
For Paid Social Media Campaigns
When tracking ROI on paid social media campaigns, the right metrics help you optimize spending and maximize returns.
Here are the top five metrics to focus on:
1. Return on Ad Spend (ROAS)
Return on ad spend (ROAS) determines whether your campaign paid off. It is the most direct way to see if your campaign is profitable, so it’s one of the favorite metrics of business owners. In contrast to ROI, ROAS is expressed as a multiplier (2x, 3x, 5x, etc.)
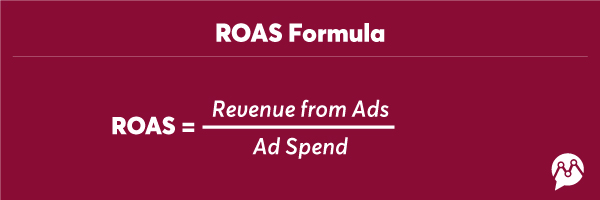
For example, if you spend $1,000 and generate $5,000 in sales, your ROAS is 5X (or 500%), which is considered a good ROAS.
Acceptable ROAS is different for every business and depends on your business model, industry, and profit margins. Though there is no pattern to define a good ROAS, on average, for every $1 you spend in paid campaigns, you should get $3-$4 in revenue.
According to a 2023 survey, B2C marketers consider YouTube (48% of businesses) as the platform with the highest ROAS, followed by Instagram (35% of businesses).
2. Cost Per Acquisition (CPA)
Cost per acquisition (CPA) is a metric that shows how much money is needed to invest in a social media campaign to gain one paying customer. The lower your CPA is, the better your campaign is doing!
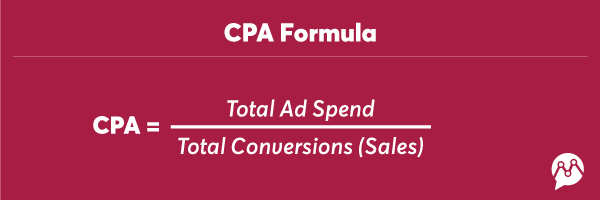
This means that if you spend $1,000 for a campaign, and gain 50 sales, your CPA is $20.
Again, it’s very difficult to determine the average CPA, since it is diverse depending on the industry, platform, business model, sales funnel, competition, target audience, and ad quality.
For example, B2B has higher CPA than B2C marketing campaigns due to the more complex B2B sales process and customer value, and it can range from $50 to $500.
– Optimize landing pages
– Refine ad targeting
– A/B test ad creatives
– Use retargeting
– Improve Ad Relevance & Engagement
3. Conversion Rate (CVR)
The conversion rate (CVR) is the percentage of users who complete a goal, such as purchasing, signing up, or downloading. The higher the conversion rate, the better.
We use the number of clicks and the number of conversions as the main parameters for calculating CVR. That means that if 1,000 people click on your ad and 50 make a purchase (or download the lead magnet), your CVR is 5%.

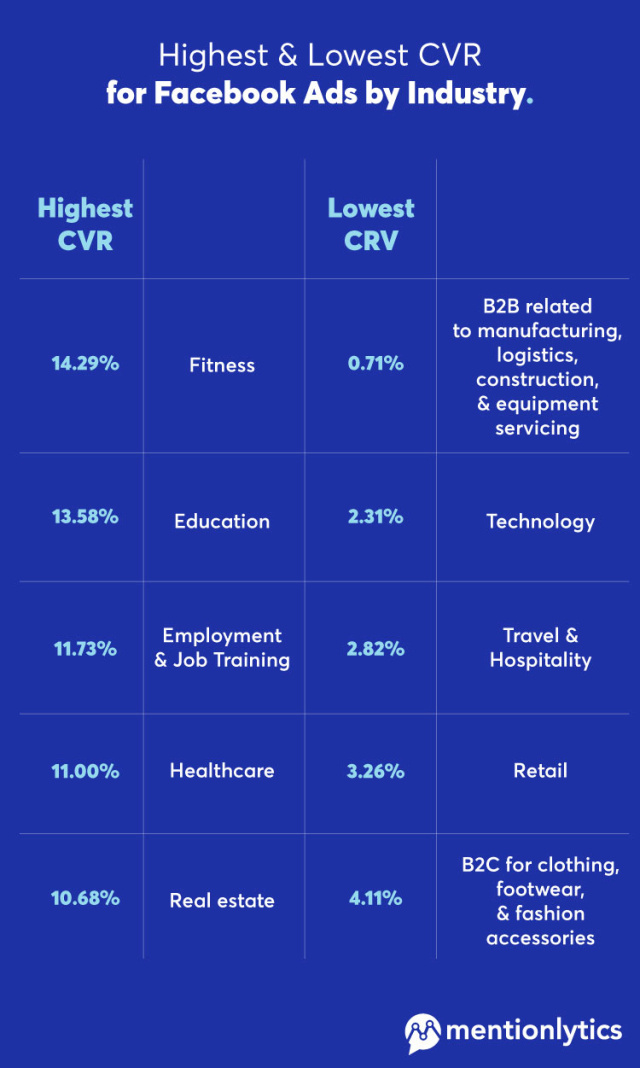
The CVR can vary depending on the industry, targeted audience, platform, and ad content and relevance. That’s why the average CVR for Facebook ads goes from 14.29% for fitness to 0,71% for industrial services.
If your social media activities underperform, you should:
- Improve Copywriting & Visuals – Redo Creatives
- Reevaluate Targeting – Are You Reaching the Right People?
- Change Platform – Are You Advertising in the Right Place?
- Improve Landing Page – Where Are You Sending People?
- Optimize Budget & Bidding Strategy – Are you spending too much in the wrong place?
- Analyze Metrics to Find the Bottleneck – Don’t just turn off the campaign, find out what you’re doing wrong.
4. Click-Through Rate (CTR)
Click-through rate (CTR) is a percentage that shows you how attractive and tempting your ad is. It uses impressions and clicks to show you how many people clicked on your ad after seeing it. The higher the CTR, the better you did your job.

This means that if your ad is seen 10,000 times and gets 500 clicks, your CTR is 5%.
The CTR rate will depend on the industry and the platform and is largely influenced by targeting, copy, visual, CTA, format, and user experience.
According to 2025 research, the average CTR for social media ads varies from 0,22% to 0,90%, depending on the platform.
- Facebook 0.90%.
- LinkedIn 0.52%
- YouTube 0.65%
- Instagram feed 0.22% to 0.88%
- Instagram stories 0.33% to 0.54%
- X 0.86%
If the results of your social media campaigns are not as expected, you might want to check these typical problems and quick solutions that might solve them.
- Low CTR? → Change ad creative & copy.
- High CTR but Low Conversions? → Fix the landing page or offer.
- High Impressions, Low Clicks? → Your ad isn’t grabbing attention (weak hook/creative).
5. Customer Lifetime Value (CLV) vs. CPA
Customer Lifetime Value (CLV) tells you how much revenue a single customer is worth to your business over time. Instead of focusing only on the first purchase, CLV considers repeat purchases, retention, and long-term revenue.
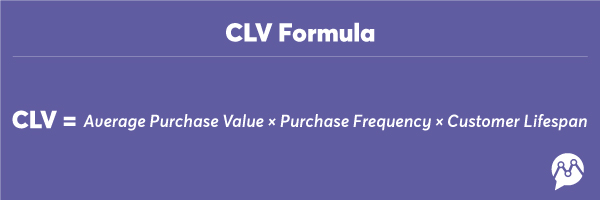
That means that if a customer typically spends $200 and makes 5 purchases over 2 years, their CLV is $1,000.
Now, customer lifespan (CL) is the average time a customer stays active with your business before they stop buying. You can calculate it by dividing the sum of the years all your customers purchased from you by the number of your customers.
For example, if 1,000 customers have been active for a total of 4,500 years, then the average customer lifespan is 4,5 years (4,500/1,000).
For Organic Social Media Efforts
No ad spend? No problem. Organic social media is a long-term game that builds relationships, trust, and brand authority. Unlike paid campaigns, you won’t see instant ROI, but the right metrics will help you measure progress and optimize your organic strategy.
Here are the top five metrics to track for organic social media efforts:
1. Engagement Rate (ER)
Engagement Rate (ER) tells you how actively your audience interacts with your content. Likes, comments, shares, and saves — these all signal that people care about your brand.

Why it matters: A high social media engagement rate means your audience finds your content valuable. A low ER? Time to refresh your content strategy.
Though the engagement rate depends on the industry, according to statistics for Q4 2024, LinkedIn is winning, with an engagement rate of 4.73%. The second place takes TikTok with 2,63%, then Instagram with 1.9% (0.43%), Facebook with 0.063%, and the lowest engagement rate has X with 0.029%.
✔ Low ER? → Post interactive content (polls, Q&A, carousels).
✔ High ER, Low Reach? → Your audience loves your content, but it’s not getting discovered — test different hashtags.
2. Reach & Impressions
Reach and Impressions measure content visibility, and it is important for brands using social media because a higher reach means your content is spreading organically. A drop can signal your content is not resonating or the algorithm isn’t favoring it.
- Reach = Unique users who saw your post.
- Impressions = Total number of times your post was displayed (including multiple views from the same user).
Let’s see what social media trends say about it.
In 2024 almost all marketers experienced a drop in organic reach, especially with Facebook and Instagram (except stories and reels, which still hold on). Last year’s favorite, TikTok, also experienced a drop in organic reach.
As for LinkedIn, according to statistics, it experienced a huge drop, from 3.92% reach in July 2024 to 2.45% reach in January 2025.
When using reach as a metric, you can track the decrease or increase of reach, or you can compare it with the number of your followers and multiply by 100 to get a percentage. It shows you how many followers have seen your post.
Beyond your own content, brand mentions also contribute to reach. Calculating their reach can tell you how many users have been exposed to conversations about your brand — whether through direct mentions, hashtags, or discussions on other accounts.
A rise in this metric means your brand awareness is growing beyond your immediate audience.
Measure Reach Beyond Your Own Content
Your brand is being talked about — but do you know how far those conversations travel? Don’t just guess — track it with Mentionlytics! Measure Brand Mentions Reach in real time and see your true social impact.
✔ Low Reach? → Test different post formats (Reels, carousels, infographics).
✔ Great Reach but No Engagement? → Your content gets seen, but people aren’t interested enough to interact — make it more engaging and actionable.
3. Audience Growth Rate
The follower count means nothing if your audience isn’t engaged. That’s why the growth rate matters more than the total number of followers.

A steady growth rate shows your content attracts new people. No growth? Your content isn’t resonating with new audiences.
✔ Growth Stalled? → Collaborate with influencers, use trending hashtags, or experiment with collaborative posts.
✔ Losing Followers? → Review past content — what’s causing disengagement?
4. Brand Mentions
Not all engagement happens in your comment section. How often are people talking about your brand? And most importantly, do you hear it?
Here are two ways you can do that:
- Use social listening tools.
- Manually search “@yourbrand” and hashtags on each platform.
If using the first method, social listening tools like Mentionlytics do all the analyses for you in just a few clicks, calculating how many mentions you have and measuring reach, engagement, and sentiment in downloadable reports and customizable dashboards.
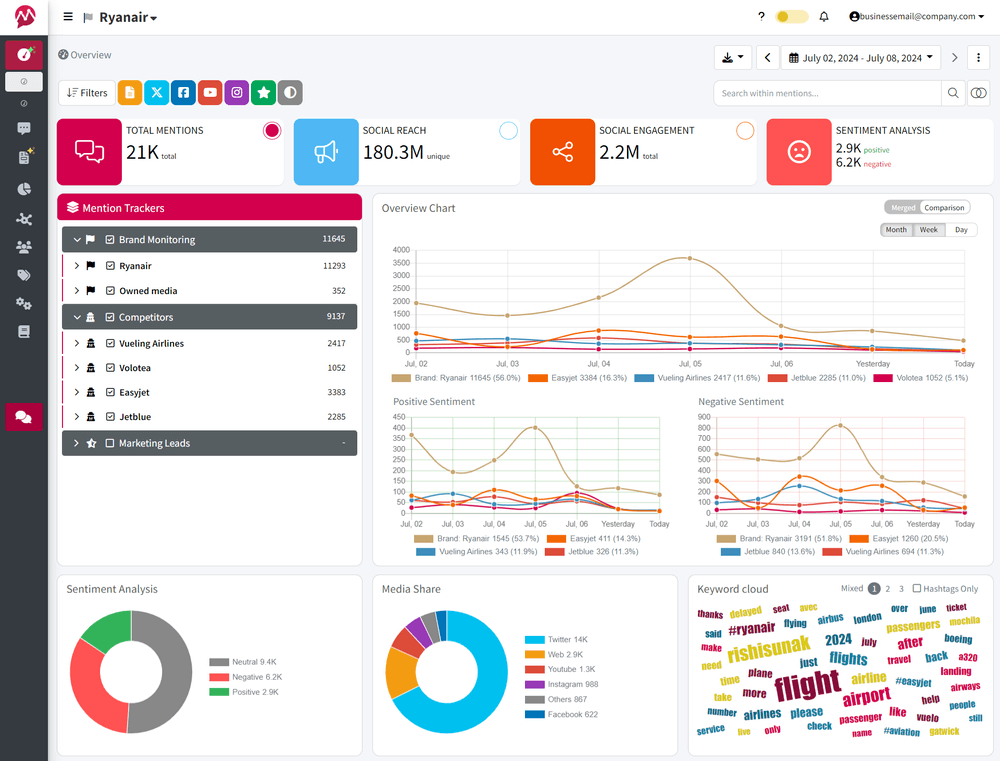
If you choose the manual system, be prepared for a time-consuming process, a lot of patience, and an Excel sheet — plus endless copy-pasting. And no matter how careful you are, you’ll probably miss something.
5. Sentiment Analysis
Knowing how often people mention your brand is great — but the true value of social media is in knowing how they feel about it. Sentiment analysis helps you understand whether your brand is being talked about positively, negatively, or neutrally across social media.
Social media management is much easier if you tap into the mood behind mentions. You can easily use it as a metric because positive mentions improve your social media marketing efforts and indirectly affect ROI.
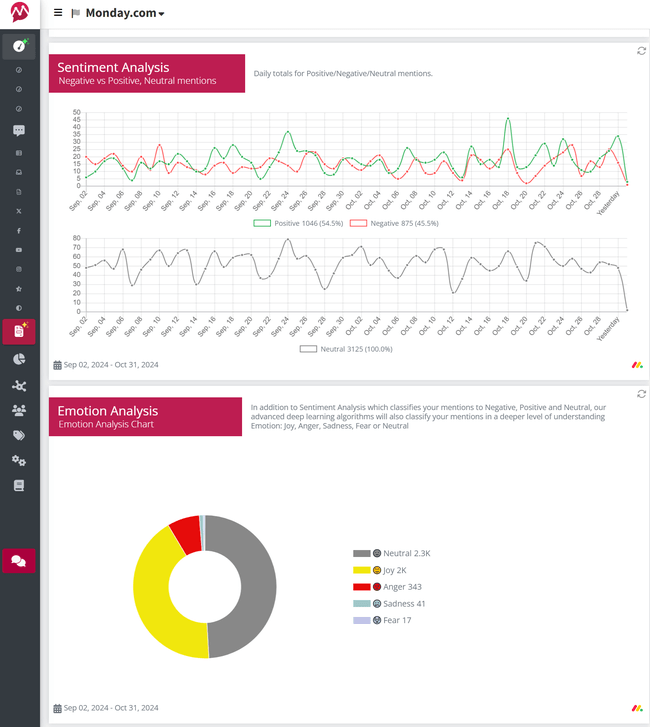
Sentiment analysis is impossible to do manually, and that’s why you’ll need a social listening tool, especially if you want to present it as a part of your report.
As a metric, it’s easy to track the increase of the positive sentiment or decrease of the negative to showcase changes in reputation, trust, and even if your brand has recovered from a recent crisis!
6. Share of Voice (SOV)
Why stop at mentions? Share of Voice tells you how much of the online chatter in your niche is about your brand vs. competitors.
What can it tell you? A higher SOV means you’re owning the conversation in your niche. On the other hand, a low SOV indicates your competitors are getting more attention and that it’s time to step up!

Use tools like Mentionlytics to track SOV. If you’re drowning in a sea of competitor mentions, hijack trending hashtags with better content.
✔ Not getting brand mentions? → Start conversations with your audience. Ask questions, create polls, and reply to comments.
✔ Competitors have more mentions? → Analyze their content strategy and identify what makes them stand out.
Challenges of Measuring Social Media Marketing ROI & Solutions
It’s easy to count shares, likes, and comments, but when it comes to ROI, social media managers almost always face challenges.
What can social ROI metrics show, and how? How to prove that the sales that just went up were because of your viral organic post?
Let’s see how you can solve that.
Challenge #1: Quantifying Brand Awareness
It’s not just about direct revenue — it’s also about brand awareness. However, measuring awareness is difficult because it doesn’t always translate into immediate sales or website visits.
One way to track it is through Share of Voice (SOV), which compares how often your brand is mentioned compared to competitors. By measuring SOV before and after a social media campaign, brands can confirm whether their presence has grown.
Social listening tools can automate this process, providing clear data on brand reach and visibility.
Challenge #2: Tracking Cross-Platform Customer Journey
Customers rarely follow a linear path to purchase. A potential buyer might see a product in an Instagram ad, research reviews on YouTube, and then visit the website weeks later through a Google search.
Offline behavior adds another layer of complexity — someone may see an ad but decide to buy in-store without ever clicking a link.
To address this, brands can use UTM tracking, multi-touch attribution models, and social listening tools that monitor brand mentions across platforms.
While full visibility is impossible, combining data from different touchpoints helps build a more accurate picture of the customer journey.
Challenge #3: Data Integrity at Risk
Manually tracking social media ROI comes with risks. Human error in data entry, inconsistent metric calculations across platforms, and missing or incomplete data make analysis unreliable.
Even within the same platform, engagement metrics can vary depending on the tool used.
Third-party analytics tools, such as Mentionlytics, help centralize and standardize data collection, reducing inconsistencies and eliminating the need for manual input.
By automating reports, businesses can ensure more accurate, up-to-date insights that support decision-making.
Measuring social media ROI will always have limitations, but combining the right tools with strategic tracking methods can provide clearer insights into a campaign’s true impact.
Measure Your ROI from Social Media Effortlessly
No more second-guessing when it’s time to present social media data. Make your reports ROI-focused and easy to understand — even for non-marketers.
You already have the data. Now, it’s about using it strategically with the right tools.
Show measurable results from social platforms. Quantify the impact of your efforts and give value to intangible outcomes like brand awareness, engagement, and sentiment.
Turn raw social data into actionable insights with Mentionlytics and create reports that clearly demonstrate the ROI of your social media strategy — without the hassle.